
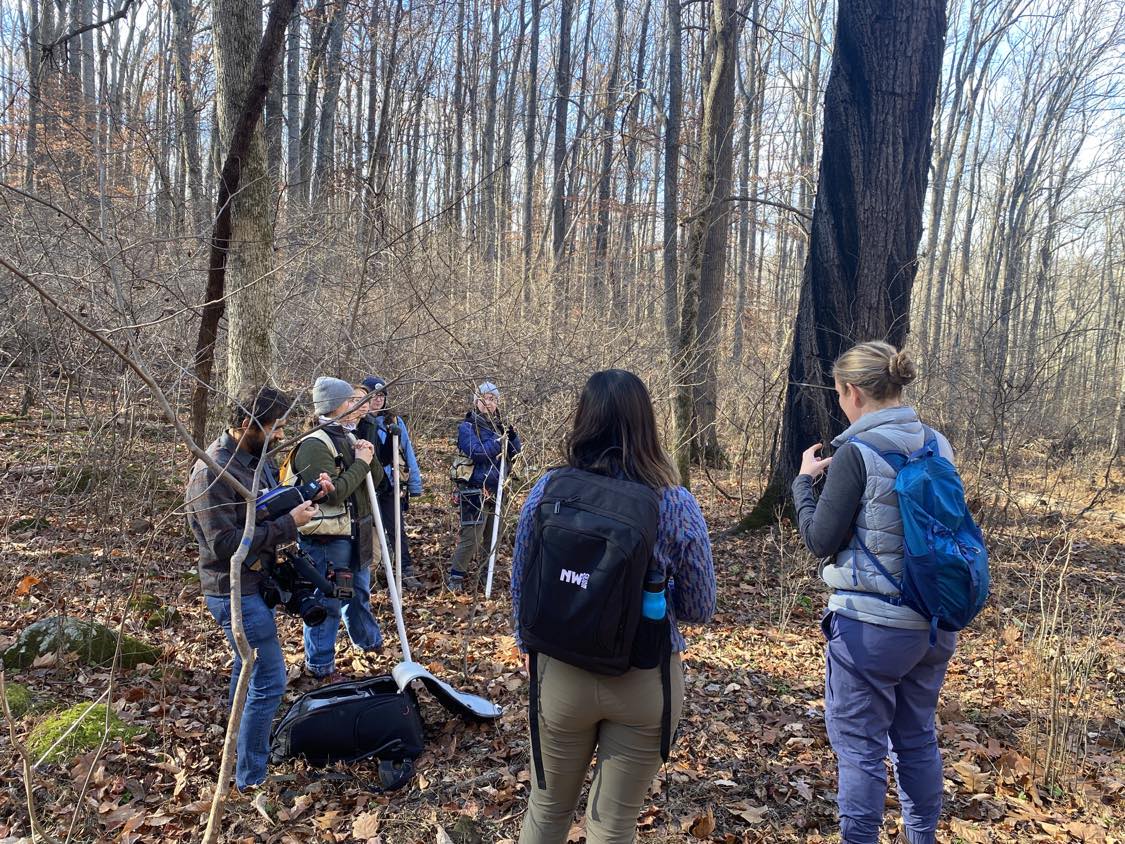
ForestGEO plot SCBI in Virginia, USA, recently completed its fourth census! The media team from the National Zoo joined us on-site to document the measurement of the final stem. We asked members of the field crew a few questions to learn more about the census process and the forest. Read on to hear what they had to share.
the measurement of the final stem of the census.
On November 30, 2023, the field crew at the Smithsonian’s National Zoo & Conservation Biology Institute plot completed its census. The media team from the National Zoo joined us in Front Royal, VA to document the measurement of the final stem and to learn more about the research to better understand forests and how they are changing.
The short informational videos are available on the National Zoo’s Facebook and Instagram pages. During the filming session, the SCBI field crew shared what the census can teach us about the forest. Two members of the four-member field crew, Krystal Bagnaschi and Iris Kennedy, share some of the highlights below.
What is the procedure for stem measurement?
This year, SCBI piloted the use of a new data collection system. In the past, data collection was done with pen and paper and later transcribed on a computer. We streamlined the process by using ESRI ArcGIS Field Maps on iPads which collected data points and notes, which were then uploaded to GitHub where checks ensured that our final dataset was free of detectable errors. This new procedure made data collection a lot easier than previous years.
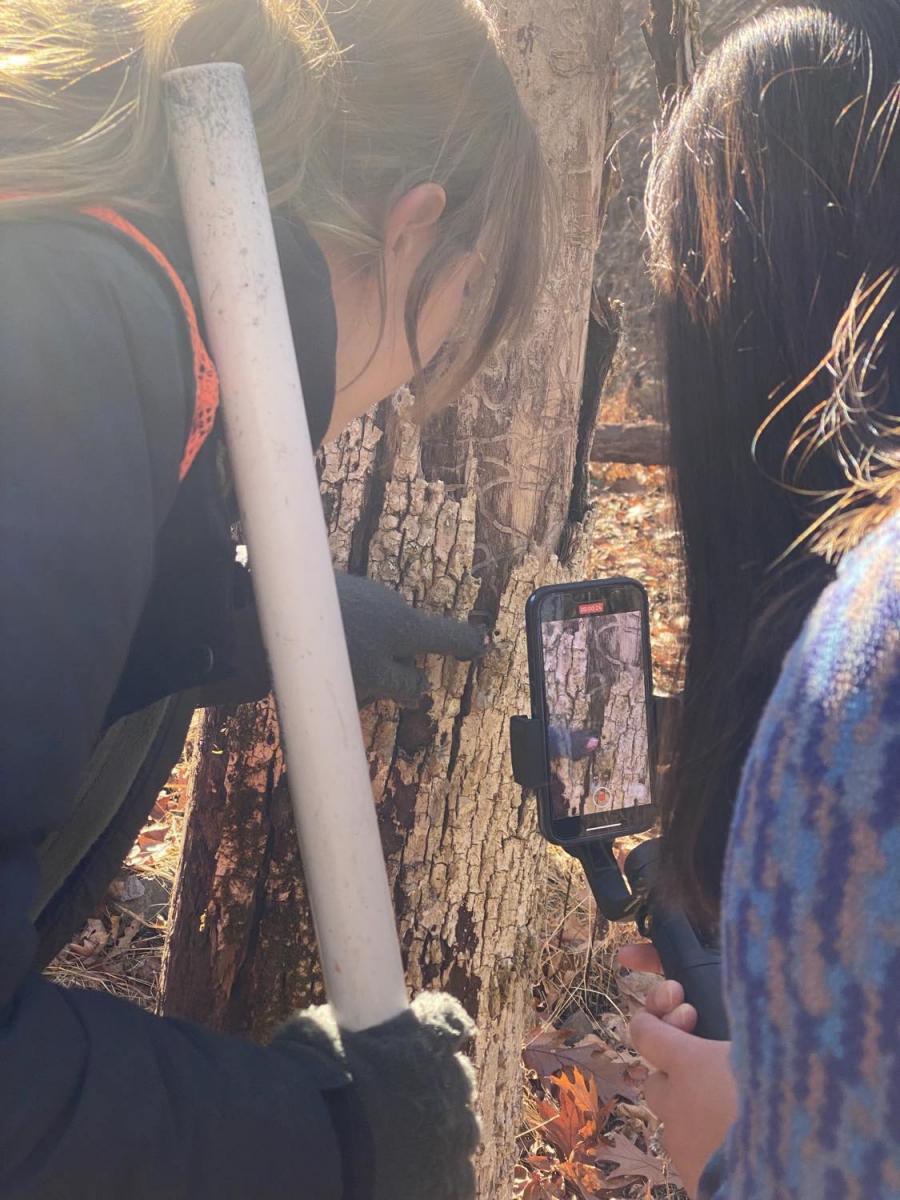
In terms of measuring the actual trees, we had a vest full of all the tools we needed: dbh tapes, small and large, spray paint, a hammer and nails, ID tags for new trees recruited into the census, flagging for trees that needed their tag replaced, and a whole arsenal of wires used for a stem identification system Each one of us worked one 20m x 20m quadrat at a time, systematically assessing and measuring each woody stem taller than 1.3m and wider than 1cm at that height. One quadrat could take us anywhere from 45 minutes to four days depending on density.
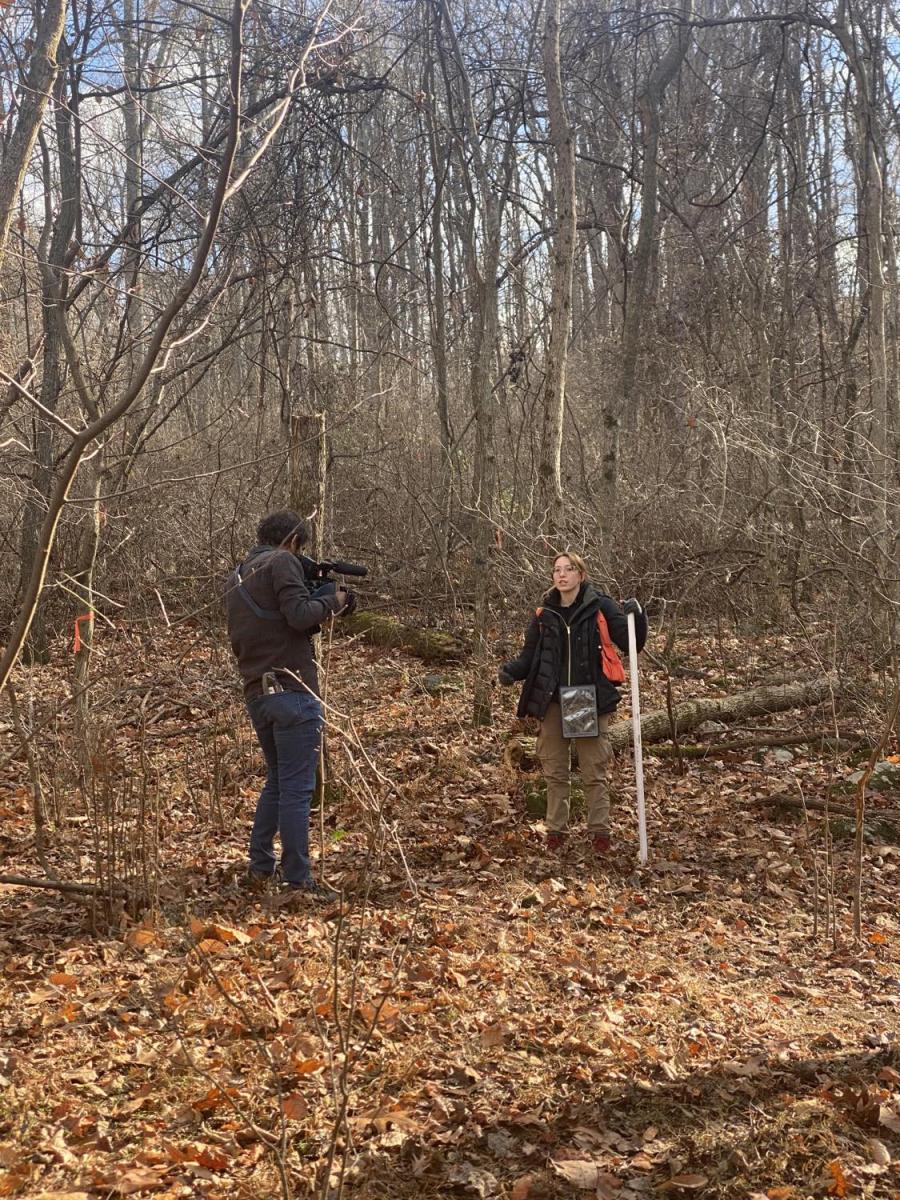
of the census to media team member Roshan Patel.
Which nuisance species are present at the SCBI plot? How do nuisance species impact the forest?
Two common nuisance species in the plot are the emerald ash borer beetle (EAB) and white-tailed deer. The emerald ash borer is problematic because it bores into ash trees (Fraxinus spp.) which are large canopy trees -- trees which have the most potential to store carbon. When the EAB bore into and kill the ash trees, it not only changes the forest dynamics but reduces the forest’s ability to remove CO2 from the atmosphere and store it. While the EAB kill the tall, mature trees, the deer eat the younger saplings, causing the understory to have less species richness. There are a few tree species that the deer do not prefer to eat: spicebush (Lindera benzoin) and pawpaw (Asimina triloba). These are shrubbier species that store significantly less carbon than canopy species, and they tend to take over gaps created by canopy trees dying. Essentially, we have nuisance insect species taking trees out of the canopy and deer eating young trees preventing the canopy trees from being replaced, so it is a challenge we are facing from both sides. Both the carbon storage and the overall species composition of the forest will suffer if we do not address these nuisance species.
media team member Ellie Tahmaseb.
Was there anything about the forest that stood out? In general, or when compared to data from prior years?
The issue of a mismatch in species composition seems to be exacerbating over the years. In most of the plot, we have a fairly dense stand of mature forest dominated by tulip poplar (Liriodendron tulipifera), oaks (Quercus spp.), and hickories (Carya spp.). Most of the understory however is dominated by relatively small, slow-growing species such as pawpaw (Asimina triloba) and spicebush (Lindera benzoin), young and old. We aren’t seeing many saplings of species such as hickories or oaks that have the capacity to reach the overstory in the future. So, as pests such as the EAB continue to kill mature trees, we do not have a reserve of sapling canopy species that will take their place - the gaps they create are filled by spicebush, pawpaw, and invasive plants such as wineberry (Rubus phoenicolasius) and multiflora rose (Rosa mulitflora). This sort of forest composition has significantly less ability to store carbon, so for the first time, we’re detecting a loss in carbon storage instead of the consistently increasing sequestration seen in past censuses.
This issue is worsened by the white-tailed deer, as proven by the composition difference outside vs. inside the deer exclosure. We have a 4-ha area in the plot around which a tall fence prevents deer from entering and browsing on the saplings. Where the deer are excluded, we saw a lot more diversity and species richness in the understory; we were discovering species that hadn’t yet been seen in the plot, such as mulberry (Morus spp.) and sugar maple (Acer saccharum), and there was much more abundance of young canopy trees, such as hickories, oaks, and even ash trees. Although the deer exclosure was affected by the same pests and pathogens as the rest of the plot, the understory demonstrated a much greater ability to restore the canopy in the future.
What are the next steps of processing the census data? How will it be used long-term?
Currently we are working through the final steps of cleaning and processing the data to analyze dynamics of the whole plot. We are using R to translate all the diameters we measured into the total biomass to then analyze how carbon storage has shifted over the last 15 years since the first SCBI census. We are also working on a paper that will soon be submitted to the New Phytologist for review illustrating those changes. Additionally, we are working towards putting the final data set on an open-source platform (GitHub) to make it available to the public and scientific community.
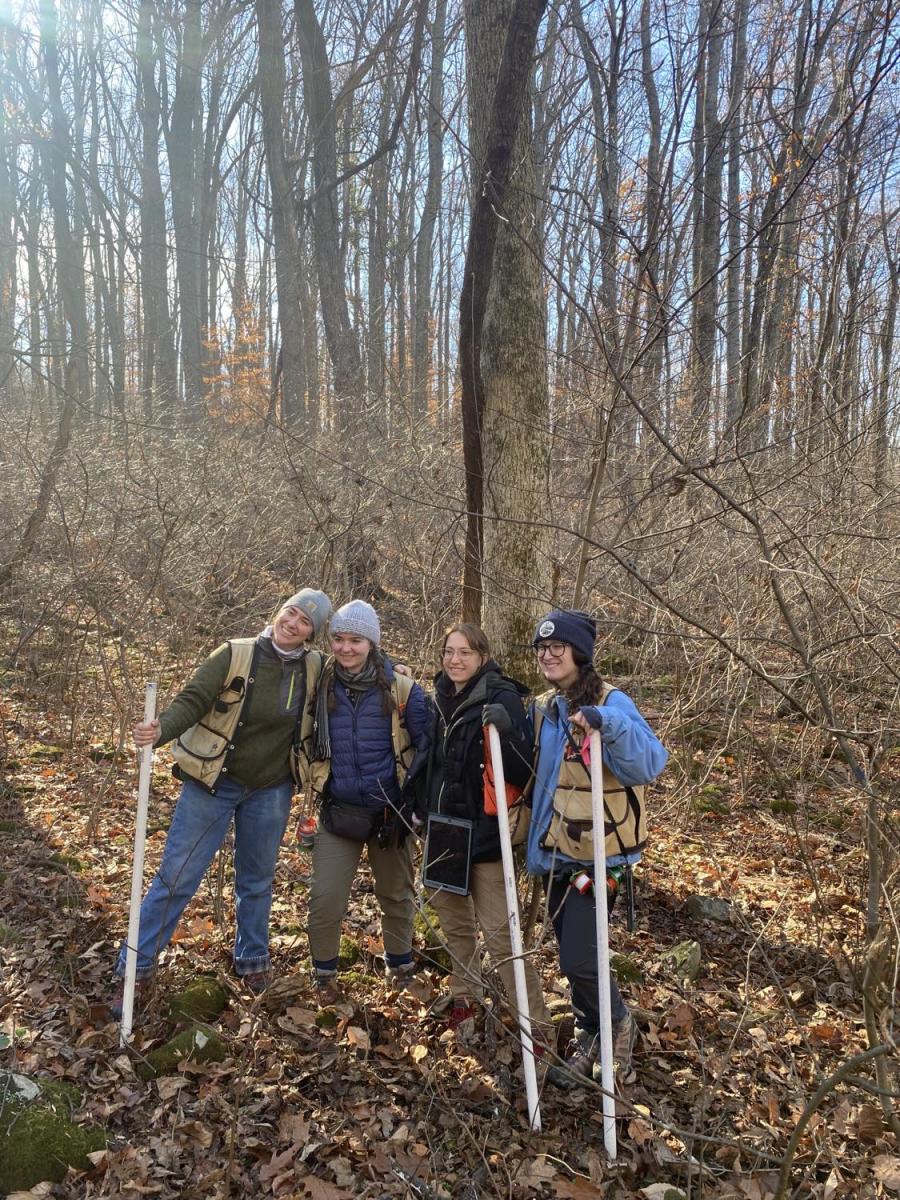
Erin MacMonigle, & Rachel Hoffman.
Congratulations to the field crew and thank you to the NZSCBI media team for documenting the completion of SCBI's fourth census!