
World Climate and Bio Climate Data for ForestGEO Sites
Sites Source: Anderson-Teixeira et al. (2014)
Last updated: August 14, 2014
Current and projected future climate data were downloaded from WorldClim (http://www.worldclim.org; Hijmans et al., 2005) in November 2013 at the highest available spatial resolution (30 arc-seconds for current climate; 30 seconds for future climate). Current climate is based on an interpolation of observed data, representative of 1950-2000 (v. 1.4). Future projections are based on predictions of the HadGEM2-ES model as part of the CMIP5 (IPPC Fifth Assessment) for the year 2050 (2041-2060 climatic average) under the lowest and highest emissions scenarios (RCP 2.6 and RCP 8.5, respectively). These data have been downscaled and calibrated using WorldClim’s current climate (v. 1.4) as a baseline, which makes it appropriate to compare current and future climate data from these sources (e.g., Fig. 2 in Anderson-Teixeira et al., 2014).
Important note:
Comparison of available local weather station data (Table 2 in Anderson-Teixeira et al., 2014) to WorldClim data revealed close correlation for MAT (R2 >97%). However, WorldClim data tended to systematically underestimate MAP at sites with high MAP, particularly those receiving >3000 mm yr-1 (e.g., Korup, Kuala Belalong, Sinharaja, Fushan, La Planada). Thus, WorldClim precipitation values for high precipitation sites should be considered probable underestimates.
Data Files
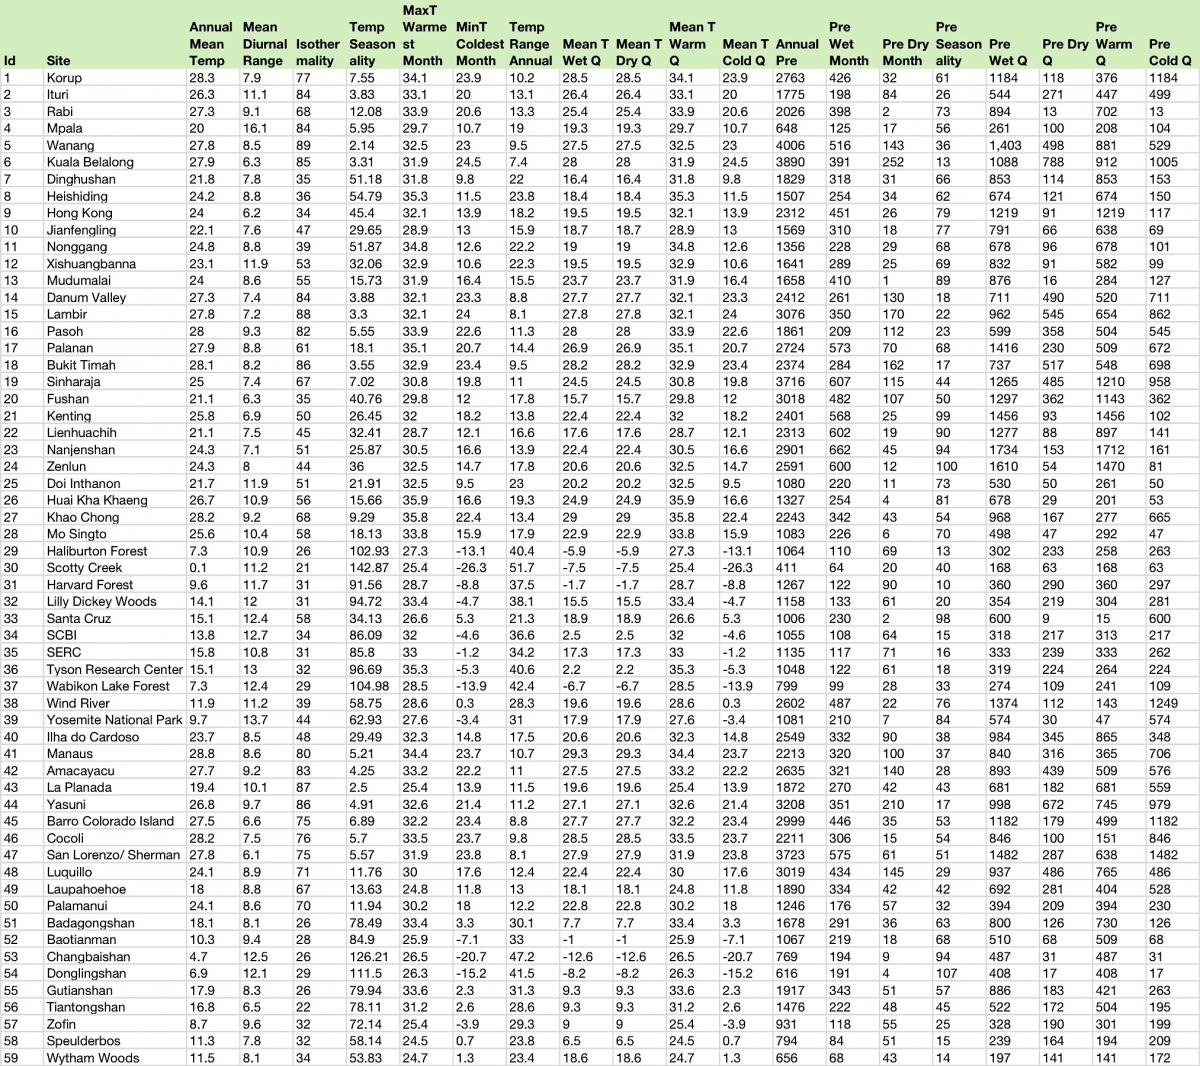
- ForestGEO_WorldClim: Recent climate (1950-2000)
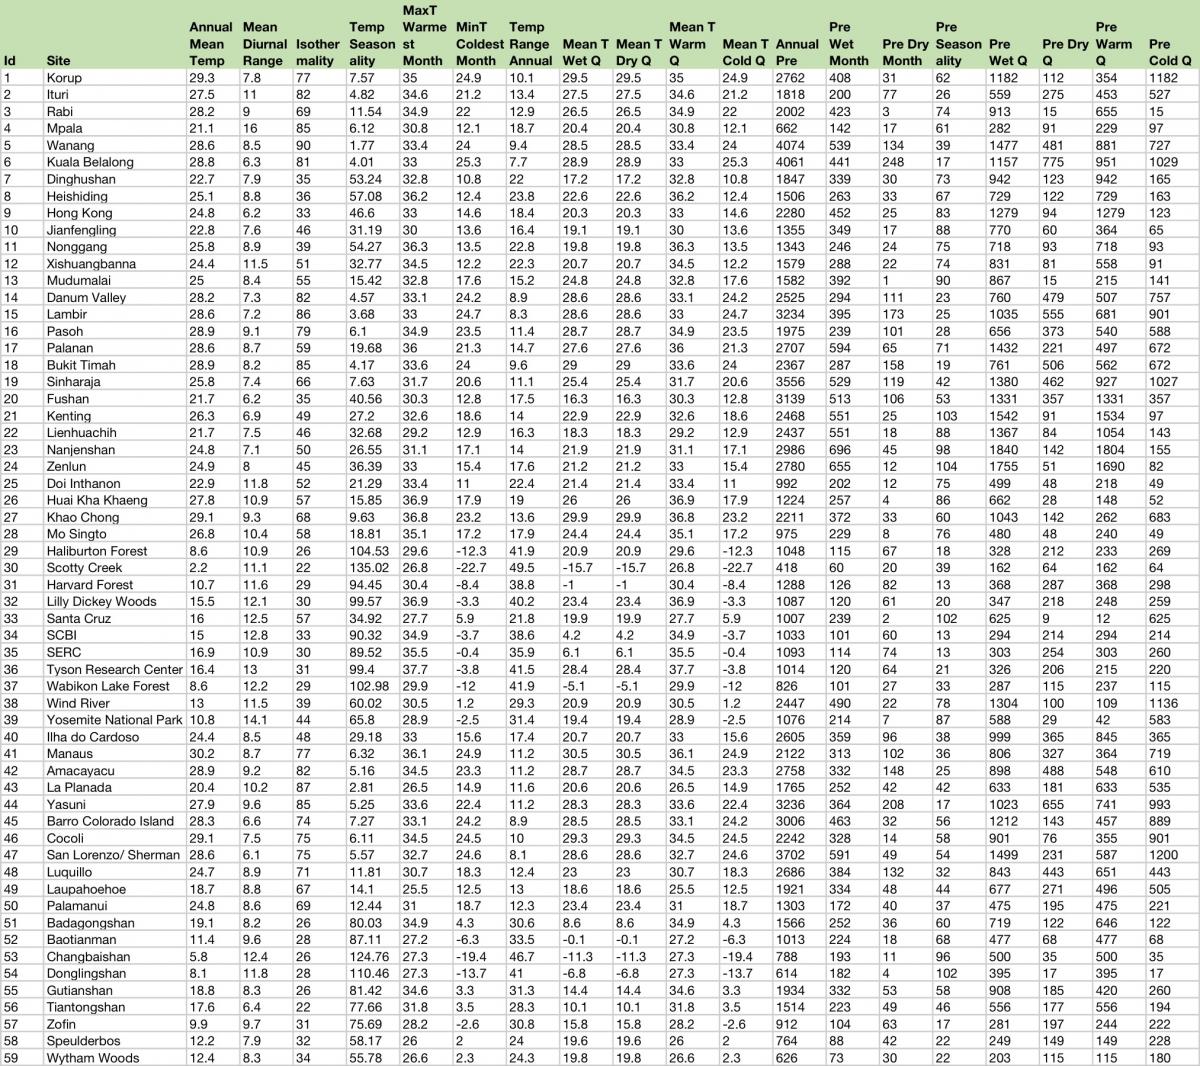
- ForestGEO_HADGEM2_RCP26.csv: year 2050 climate projections under lowest emissions scenario considered in IPCC5 (RCP 2.6)
- ForestGEO_HADGEM2_RCP85.csv: year 2050 climate projections under highest emissions scenario considered in IPCC5 (RCP 8.5)
Data Files Contents
|
Column |
Description |
Units |
|---|---|---|
|
Id |
Site ID number in Anderson-Teixeira et al. (2014) |
- |
|
Site |
Site name |
- |
|
AnnualMeanTemp |
Annual mean temperature |
°C |
|
MeanDiurnalRange |
Mean Diurnal range (mean of monthly maxT-minT) |
°C |
|
Isothermality |
Isothermality (MeanDiurnalRange / TempRangeAnnual)*100 |
% |
|
TempSeasonality |
Temperature seasonality (standard deviation) |
°C |
|
MaxTWarmestMonth |
Maximum temperature of warmest month |
°C |
|
MinTColdestMonth |
Minimum temperature of coldest month |
°C |
|
TempRangeAnnual |
Temperature annual range |
°C |
|
MeanTWetQ |
Mean temperature of wettest quarter |
°C |
|
MeanTDryQ |
Mean temperature of driest quarter |
°C |
|
MeanTWarmQ |
Mean temperature of warmest quarter |
°C |
|
MeanTColdQ |
Mean temperature of coldest quarter |
°C |
|
AnnualPre |
Annual precipitation |
mm yr-1 |
|
PreWetMonth |
Precipitation of wettest month |
mm mo-1 |
|
PreDryMonth |
Precipitation of driest month |
mm mo-1 |
|
PreSeasonality |
Precipitation seasonality (coefficient of variation) |
- |
|
PreWetQ |
Precipitation of wettest quarter (3 months) |
mm 3 mo-1 |
|
PreDryQ |
Precipitation of driest quarter (3 months) |
mm 3 mo-1 |
|
PreWarmQ |
Precipitation of warmest quarter (3 months) |
mm 3 mo-1 |
|
PreColdQ |
Precipitation of coldest quarter (3 months) |
mm 3 mo-1 |
Recent Climate (1950-2000)

RCP 2.6 Climate Projections
RCP 8.5 Climate Projections
How to Cite
Publications using these data should cite Anderson-Teixeira et al. (2014) and WorldClim (http://www.worldclim.org; Hijmans et al., 2005).
Citations
Anderson-Teixeira KJ, Davies SJ, Bennett, AC., Gonzalez-Akre EB, Muller-Landau HC, Wright SJ, et al. (2015) CTFS-ForestGEO: A worldwide network monitoring forests in an era of global change. Global Change Biology.
Hijmans RJ, Cameron SE, Parra JL, Jones PG, Jarvis A (2005) Very high resolution interpolated climate surfaces for global land areas. International Journal of Climatology, 25, 1965– 1978.